As a Senior Business Analyst as IBM, I was informed that the latest company report was released and the employee retention rate has dropped to 84%. My job is to discover what the key drivers are for employees churning and predict IBM employees at risk of churning.

As a Senior Business Analyst as IBM, I was informed that the latest company report was released and the employee retention rate has dropped to 84%. My job is to discover what the key drivers are for employees churning and predict IBM employees at risk of churning.

For this project I assume the role of Senior Data Analyst for Maven Airlines, a US-based airline headquartered in Boston, Massachusetts. The latest passenger survey results just came in and it looks like the satisfaction rate dipped under 50% for the first time ever. Using Excel Formulas, Pivot Tables and Charts insights are drawn and a data-driven strategy for increasing Maven Airlines' satisfaction rate is recommended.

This project explores COVID-19 data from January 2020 to November 2022. Basic to advanced SQL queries are executed to answer questions and look at trends over the course of COVID-19. After the data exploration is complete in SQL, the queries are used to create some data visualizations in Tableau.

This project predicts the class of wine samples from using classification models. Classification is used to learn both the labels for each wine sample while characterizing the classes at the same time. After classifying with a Gaussian Naive Bayes model, it is compared to Logistic Regression, SVM and Decision Tree classifier models. A model comparison analysis is done using accuracy scores, learning curves and confusion matrices to determine which model is recommended for prediction.

Being able to model, predict, and monitor air quality is becoming more and more relevant, especially in urban areas, due to the critical impact of air pollution on citizens’ health and the environment. Accurate forecasting helps people plan ahead, decreasing the effects on health and the costs associated. This project analyzes an air quality dataset that contains the responses of a gas multisensor device deployed on the field in an Italian city. Some exploratory data analysis, a regression analysis and model selection is performed in Python using Pandas, Numpy, Sesborn and Scikit-learn for this project.

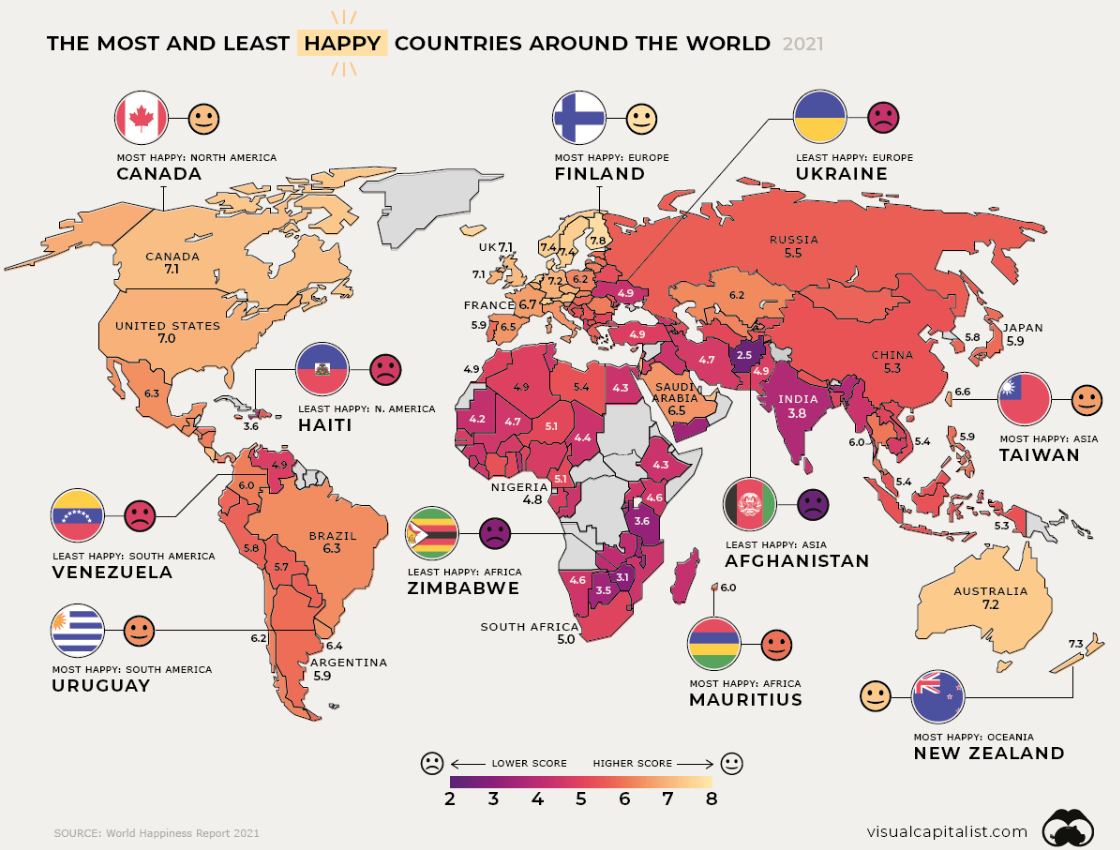
This project analyzes the 2020 World Happiness Report to draw conclusions about the general well being of 153 countries is the world.


